Candlesticks are a popular tool used in stock trading to analyse price movements in the market. They are part of technical analysis, a method that traders use to predict future price action. When looking to buy stocks online, understanding candlesticks is essential, as they provide insights into market trends, helping you make more informed decisions.
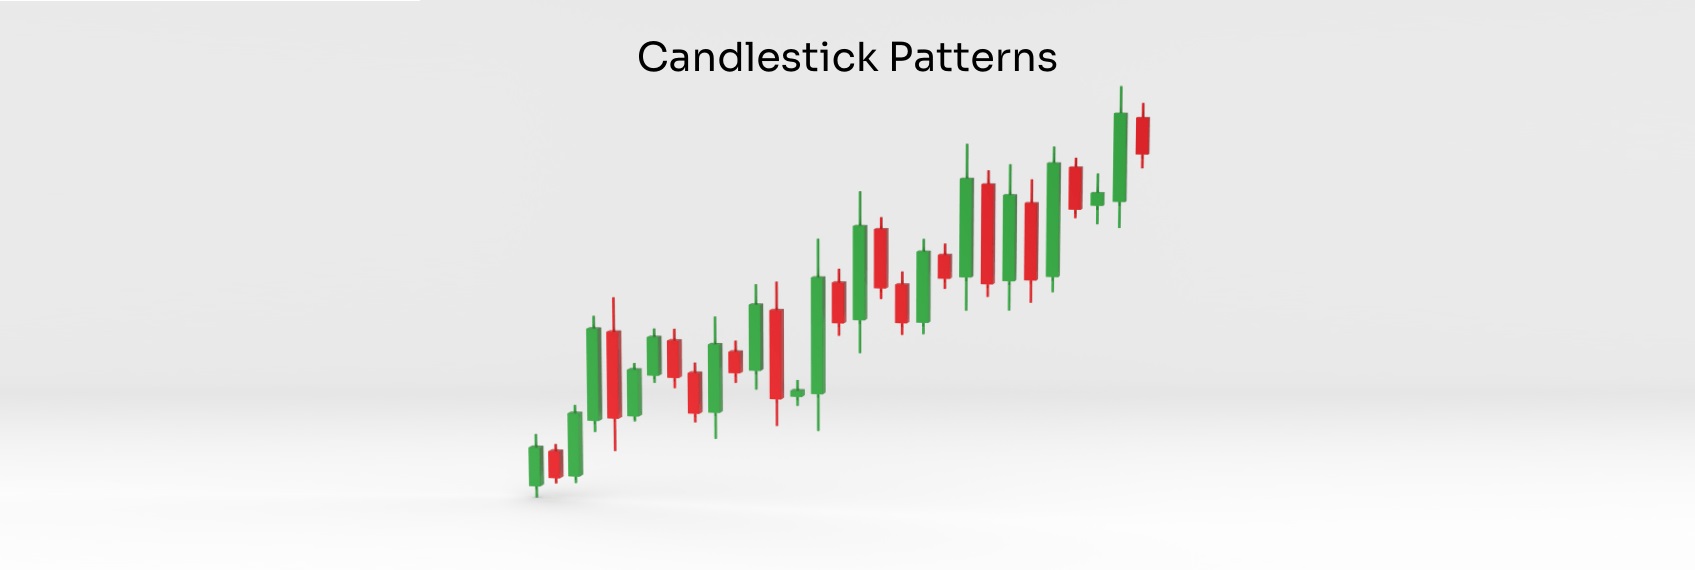
The candlestick chart is composed of individual "candles" that represent price changes over a specific period. Each candlestick shows the open, high, low, and close prices for that period. The shape and colour of these candlesticks provide valuable information about the market's direction.
Candlesticks are valuable because they effectively represent market sentiment. Each candlestick consists of a body and two wicks (also called shadows). The body displays the range of prices from the opening to the closing for the specified period. The wicks represent the peak and lowest prices within that specific period.
Candlesticks help traders identify potential market reversals, trends, and price patterns. Using these signals, you can better predict whether to buy or sell stocks. If you are exploring a trading platform in India, most platforms will offer candlestick charts to aid in your decision-making process.
A candlestick chart allows traders to see price movements clearly over various timeframes, from minutes to days or even weeks. The main purpose of this chart is to display market trends and changes in price direction, helping traders make more strategic decisions.
In the short term, a trader may use candlestick patterns to identify quick entry and exit points. On a longer timeframe, these patterns can help traders identify broader market trends. By using a trading platform in India, you can easily access candlestick charts and incorporate them into your trading strategy.
Understanding candlesticks is crucial because they provide a snapshot of market behaviour. By examining candlesticks, traders can assess the intensity of market trends and gain insights into market sentiment. They rely on candlesticks to identify patterns such as:
If you're looking to buy stocks online, these patterns can act as useful indicators, helping you know when to enter or exit a trade.
There are numerous candlestick patterns that traders look for, and each one tells a different story about market movement. Here are some common ones:
Recognising these patterns can help you predict where the market is heading, which is especially useful when you buy stocks online.
If you are interested in using candlesticks to inform your stock trading strategy, you can easily find a trading platform in India that offers candlestick charts. These platforms allow you to buy stocks online and track market movements in real-time.
Many popular trading platforms offer a range of charting tools, including candlestick charts, to help you analyse price action and make informed trading decisions. Whether you're a beginner or an experienced trader, these platforms provide the resources you need to stay ahead of the market.
Traders often make some common mistakes while using candlestick patterns, such as:
Being aware of these mistakes and using candlestick analysis along with other indicators can improve trading accuracy and decision-making.
Candlestick patterns are a helpful tool for traders looking to analyse market trends and make informed trading decisions. They provide insights into price movements and market sentiment, helping traders predict potential reversals and trends. Whether you are a beginner or an experienced trader, understanding candlestick charts can enhance your trading strategy and improve your ability to buy stocks online effectively.

For android only