For traders navigating the sometimes-choppy waters of the financial markets, volatility can be both friend and foe. The Chop Zone indicator emerges as a valuable tool to identify periods of consolidation or range-bound price movements. This blog dives deep into the Chop Zone indicator, and its functionalities, and explores effective strategies to leverage it in your trading endeavours.
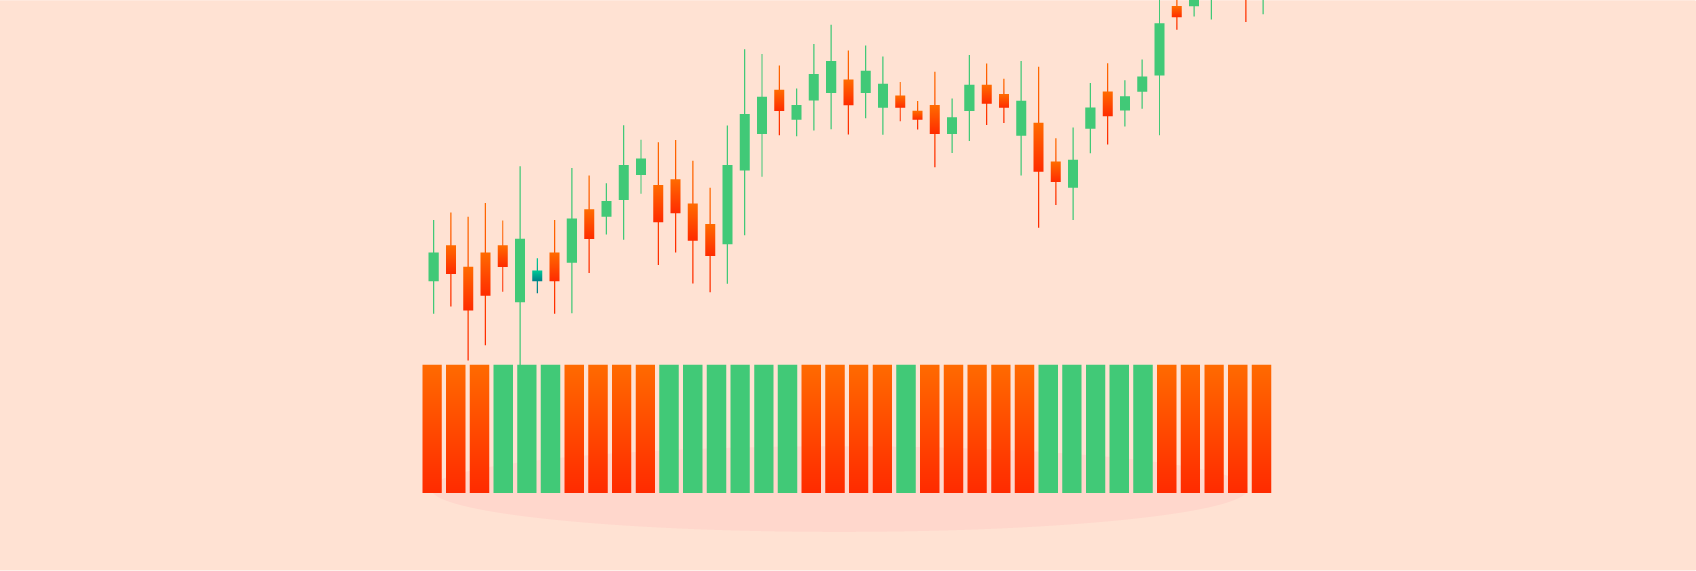
Unlike traditional volatility indicators, the Chop Zone doesn't measure the magnitude of price swings. Instead, it focuses on the direction and strength of the trend or the lack thereof. The indicator visually depicts three zones using colour bars:
The Chop Zone indicator derives its signals from the Choppiness Index (CHOP), a mathematical formula that calculates the absolute value of the difference between consecutive daily high and low prices, divided by the prior day's closing price. The CHOP value typically ranges between 0 and 100, with higher values signifying a more "choppy" market.
While the Chop Zone indicator provides valuable insights, it shouldn't be used in isolation. Here are some effective strategies to integrate it into your trading toolbox:
The Chop Zone indicator empowers you to identify periods of consolidation and assess the trend's strengths or weaknesses. By understanding its functionalities, and limitations, and employing effective strategies, you can leverage it to make informed trading decisions, particularly during unclear market conditions. Remember, the Chop Zone indicator is one piece of the puzzle; a successful trading strategy often involves a confluence of technical analysis and sound risk management practices. So, trade wisely, and navigate those choppy market waters with a bit more clarity!

T+1 And T+2 Settlement Explained: Meaning, Impact And Holiday Rules
2 min Read May 29, 2026
Stocks to buy for long term: HDFC Bank, HCC among 8 stocks Ventura's Vinit Bolinjkar suggests for 18-115% gains
2 min Read May 29, 2026
Why asset allocation matters more than stock picking in 2026
2 min Read May 29, 2026
Are defence funds overvalued after a 25% rally? What investors must know
2 min Read May 27, 2026
Is this the right time to enter the stock market? Or should you wait?
2 min Read May 26, 2026


For android only